Home Labs
Labs. They are often a dreaded component of science courses. They tend to be long, highly technical, and not particularly creative either in terms of experimental approaches or report write-ups (not if you want a good grade, anyway). My predominant memories of physics and chemistry labs in college were boredom, frustration, and anxiety. But at least in a physical lab, things can blow up or break or catch fire. Digital facsimiles take away even that bit of randomness, as simulators are powered by predictable equations. With simulators, you are playing around with someone else’s understanding of reality, not reality itself. This semester, while teaching introductory physics remotely at the University of the Virgin Islands, I challenged myself to teach a lab course without depending on any virtual simulators.
Labs emerge from the deficiencies of the lecture model for science classes. Lectures are very good at conveying mass quantities of information, which science has been exceptionally good at amassing and distilling into useful knowledge. But that distillation process is the actual core of science, and a lecture doesn’t quite convey that. Describe how the process works in abstract terms, maybe. But if you’re told how to fix a car, with rare exceptions, you’re not going to be able to open the hood and start enacting repairs after just a few high-level lectures. You would want to have some practical experience beforehand, hence the lab.
Unfortunately for the lab, practical lab experience isn’t particularly useful for the vast majority of students whom we channel through lab courses. In a typical lab, students use specialized equipment that requires training, perhaps conveyed in as little as ten to fifteen minutes. Equipment can be old or barely functional if the school is underfunded. And if a student doesn’t quite master the equipment, then all the subsequent results can be pretty bad, rendering lab reports painful to write for the student and read and grade for the instructor. And most students will never use those instruments and methods ever again, even students who continue into science careers.
In a professional lab setting, the most important tool that a scientist has is critical thinking. A scientist needs to be able to identify the questions to ask and the best equipment and methodologies necessary to answer those questions. These instruments and methodologies can be derived from others’ work or something that you yourself create. Importantly, a scientist needs to be aware of the limits of the tools and approaches they are using, as misuse can still provide data, but data that doesn’t really mean anything. Simply put, high school and college labs aren’t set up to teach any of these skills. They are designed to verify something stated in lecture, or to train students how to use specific (or outdated) equipment and methodologies. If critical thinking comes out of this, it’s more of a happy accident than a deliberate outcome of our teaching approaches.

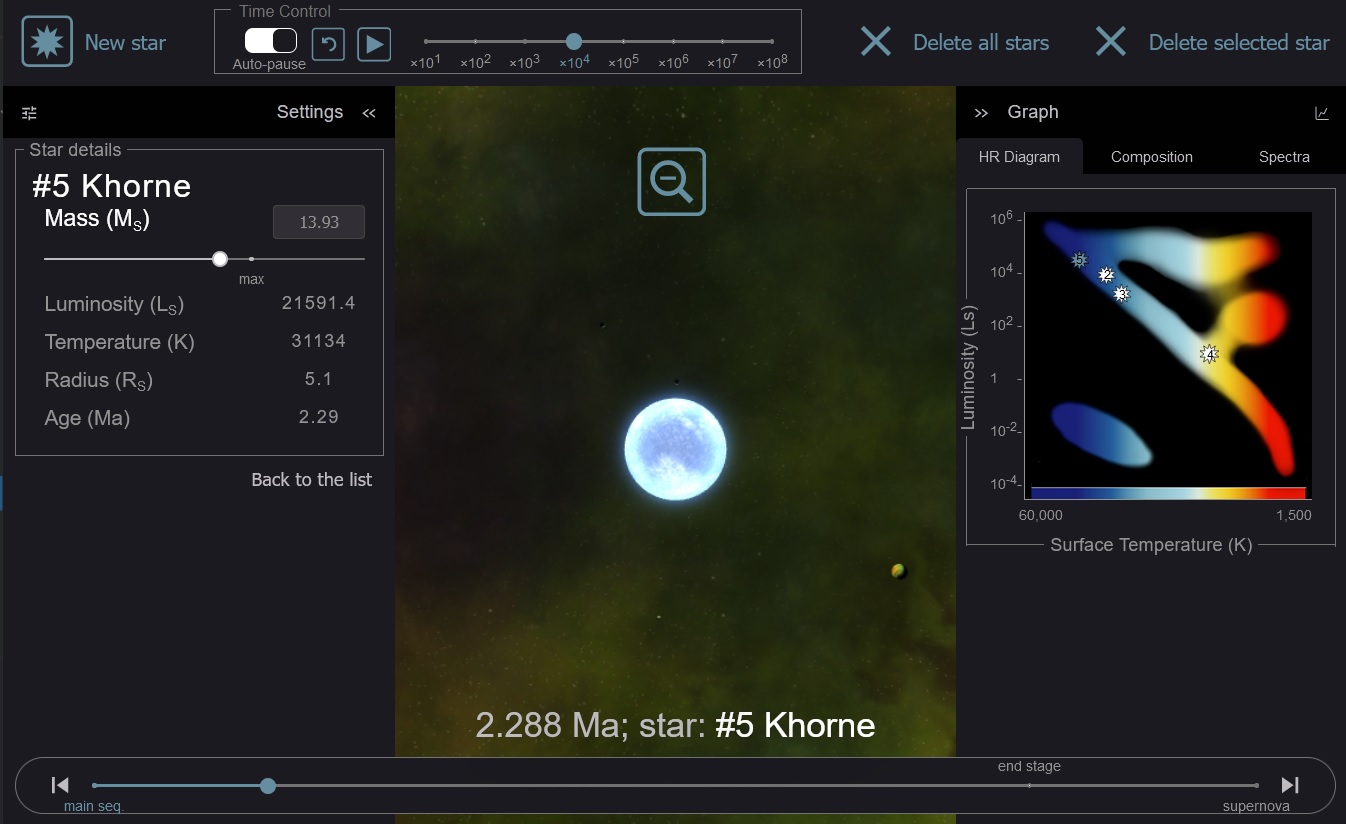
A stellar nursery simulator in Habitable Worlds where students can create stars of various masses and examine their life cycles and deaths. This simulator uses data from actual scientific models of various stars, coupled with graphics to help visualize those data.
I spent years tackling this issue in the digital realm through Habitable Worlds. With digital simulators, the “experiments” can become more creative. For example, why play around with a digital light bulb to explore luminosity when you can drag a probe around the solar system and explore alien stars? What you do in a physical lab is already an abstraction of the real world. A digital version is an abstraction of an abstraction. Why not jump straight to a virtual version of something interesting? Explode a star. Vaporize a planet. Grind plate tectonics to a halt. Digital simulators can be a lot of fun when you use them to replicate reality, rather than lab equipment.
When done creatively, digital simulators can be engaging and fun to play with. But they have multiple shortcomings. An important one is lack of real-world variability. Because simulators are programmed with equations and mathematical models, they will always provide you with the desired outcome. Some simulators incorporate randomness or noise to mimic real-world variability. But everyone knows that this is artificial and that fakeness can break immersion. Additionally, virtual labs only cater to the visual (and occasionally sonic) components of actual lab work. The other senses can be just as important, depending on the kind of work you do. The heft of lab equipment, temperature of an instrument, and smell of a reaction can provide important clues as much as any visual and numerical output can. These aspects of lab work cannot be properly replicated in a virtual setting. Some groups are moving towards virtual reality as a way of trying to incorporate other senses, particularly touch via haptic feedback. But this highlights one pretty significant drawback to digital labs.
Building digital labs is freaking expensive.
A simulator in Habitable Worlds could cost anywhere from $10,000 upwards (and often very much upwards). And as technology changes and ages, the sims need to be rebuilt, often at a higher cost. I had to do that at least once in Habitable Worlds‘ decade of existence when shifting the sims from Flash to HTML5. At least I always designed sims to be utilizable outside of the specific platform we were using so that almost all the functionality was available in a stand-alone version if a teacher wanted to use it in another way than I had envisioned. But subsequent team endeavors were less forward looking, often focusing on shortcuts to address an immediate deadline or challenge. When built this way, simulators have very little reusability aside of a specific lesson design or platform, making digital labs very cost inefficient and undesirable for teachers who don’t want to be constrained by someone else’s classroom designs.
So maybe it’s time to take a step back and figure out what exactly labs should be for. Do we want students to prove to themselves that something we said in lecture is true? OK, but that’s a demo, not science. Do we want to teach them how to use a particular instrument or methodology? OK, but probably useful only for majors and students who will specialize in that topic.
I’d argue that what we want to teach students is critical thinking and how to derive understanding from observing the world. That would necessitate quite a different lab structure than verification labs or digital versions of the same.

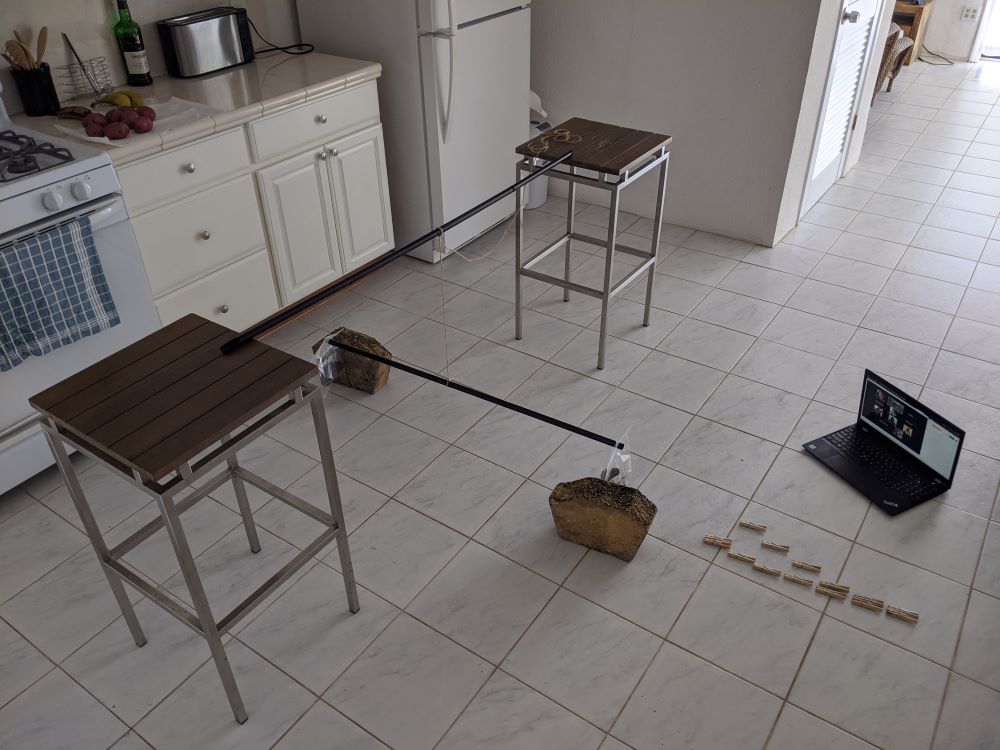
Setup for the Cavendish experiment at home using bar stools, curtain rods, string, baggies, and rocks. Clothesline clips were used to mark how much the rod rotated (since I didn’t have post-it notes or any way to mark motion otherwise). Students were conducting their own version of this (and other experiments) at home, while I was running this version in my kitchen. It required all windows and doors to be closed and all fans and air conditioners to be off, which was fairly unpleasant in September in the tropics.
I played around with such a lab structure online this semester at UVI. Because of the pandemic, everything was online, including the labs. I really wanted to avoid digital toys as much as possible, as introductory physics labs are already quite rote and boring and digital versions of physics labs tend to be even less interesting. So I decided to try free-for-all home labs.
As I previously wrote, observation journals played a key role in my class. At the beginning of each new unit, I had students write down observations they had made in their daily lives that were related to the topic we would be studying next. After these “field observations”, we then proceeded to our lab-at-home. Because the topic was introductory physics, this perhaps was a bit easier to do than, say, for biology or chemistry. Each lab had the following structure:
- Introduction to the topic and some of the home experiments students could do. For example, during gravity week, options included: dropping and timing falling objects; the Cavendish experiment; exploring Stellarium to find patterns in planetary motion (I consider digital planetariums to be an acceptable exception to the no-digital-sims rule, as they are a purely observational tool that provides countless options for instructors)
- Orientation to the group Google sheet where everyone would be documenting their observations
- Free-for-all 1.5-2 hours where students could make detailed observations of one experimental option, or less detailed observations of more than one experimental option
- A discussion in the last half hour to make sense of the group spreadsheet
Each lab was designed to use only materials that could be found at home. I was at a considerable disadvantage compared to my students, actually, since I had arrived with a bag of clothes, a bag of electronic gear, and a bag of field gear with not much more for the year. Everything else I had to scrounge from the house and yard of the place I was renting. This was by design as well, since I wanted to emphasize to students that they didn’t need fancy gear in order to make quality observations. A lab observation is just like a field observation, except that you are controlling the environment a bit more so that you can tease out connections that are not easily observed in a field environment. This is an easier lesson to convey if students aren’t struggling to understand how to use decrepit old lab equipment and are instead working with what they already have and understand how to use.

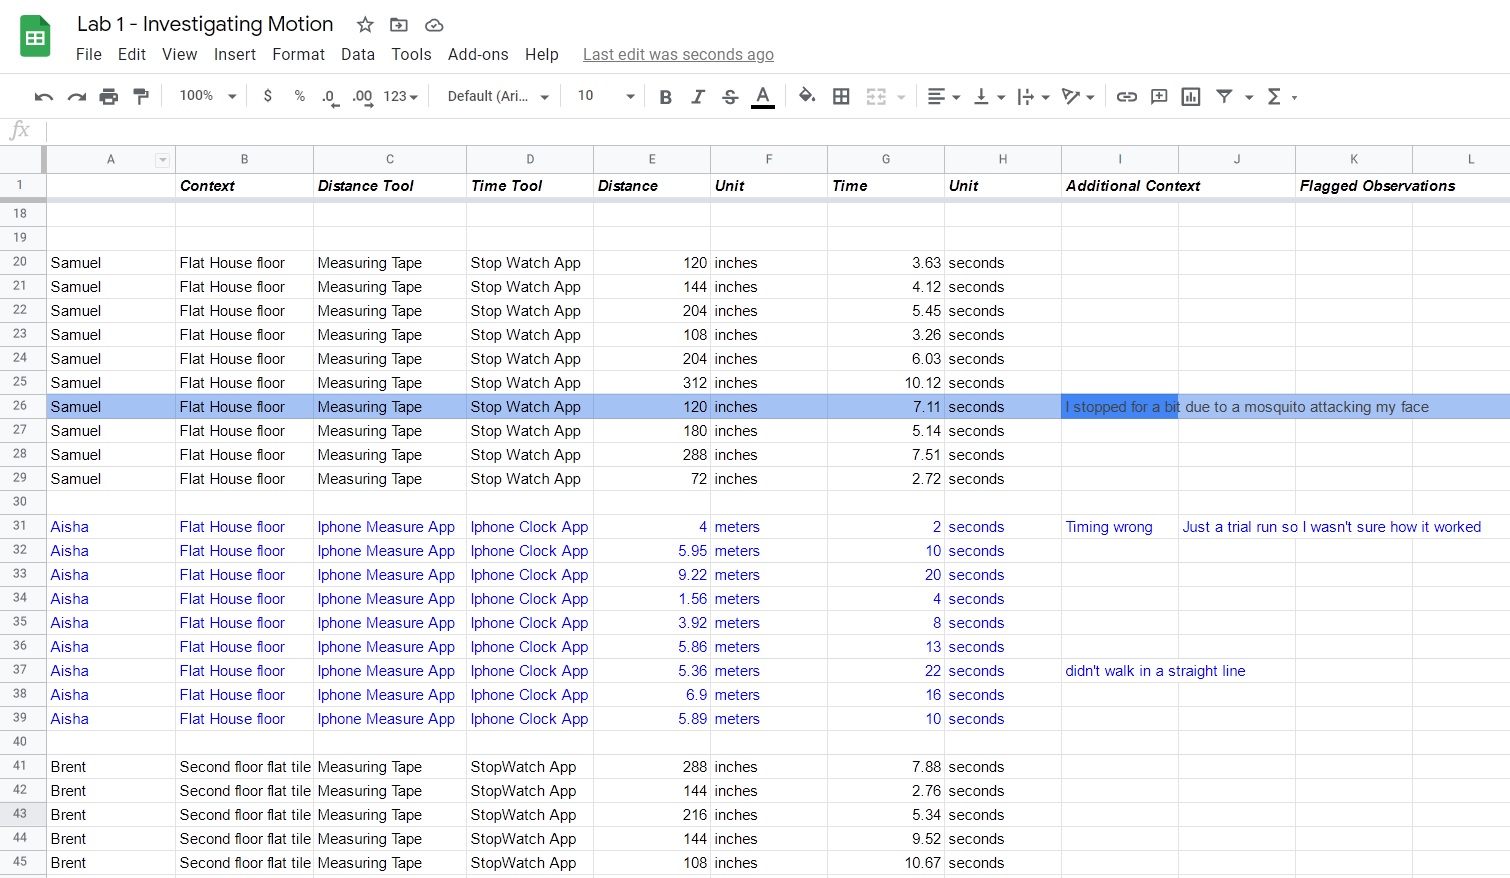
In the class Google sheet, students record where they are making their observations and what equipment they are using, and then record their results and the units they used. Afterwards, we convert everything to SI units and discuss our results. Students then have this sheet available to use when writing up their reports. For this particular lab, I was teaching how to identify invalid observations, hence the request to record all observations, even ones with mistakes, and indicating the nature of the mistake or experimental inconsistency.
Because of the freeform nature of the lab, the ensuing Google sheet was often quite chaotic and messy. I had students report their observations in whatever units were easiest to work with. In my case, without a measuring tape or ruler of any kind, I used the tiles of my apartment to measure distances (which I later converted to SI units using some measuring apps and guesstimation to determine how big the tile probably was). I completed these labs alongside my students, often because it was pretty fun to throw things around the apartment and spray water, soap, honey, and liquor all over the kitchen. I was shocked, for example, at getting my hacked together Cavendish experiment, using bar stools, curtain rods, string, baggies, and rocks and bricks from the yard, to actually work. By working alongside my students, I helped model for them lab behaviors I wanted them to emulate, such as multiple replicates and controlling variables.
Once all the observations were complete, we converted everything to SI units and then spent the last half hour trying to make sense of what we had done. I would review all the data and pick out interesting things to highlight and discuss. Once when I was deep into rambling mode, a student stopped me to ask how I was able to identify bad data so quickly. I stopped to think about what I was actually doing. “Patterns. I’m looking for patterns and things that don’t match the patterns or what I would expect to find,” I stated. This “pattern analysis” approach resulted in a couple of great teaching moments early on in this lab sequence:
- When figuring out our walking paces, one student had a really discordant result (4 m/s compared to everyone else’s 0.5-1 m/s). I knew exactly what had happened because under the “context” column, he had written “UVI track field”. I asked other students to try to figure out what was going on and then asked him to explain why his results were so different. He admitted that he was running because he wanted to get his training in during lab. This became a great example on “reproducibility” where internally he was able to reproduce his running speed reliably, but externally, since no other student ran, we couldn’t determine whether his run speed was typical or atypical for the class.
- Students were free to use whatever measuring equipment they had available. One student used a ruler, measuring app, and GPS to measure distances she walked, as well as different timing devices. After conversion to SI units, her results were all consistent. This became another great example of “reproducibility”, since every method of observation was giving the same result, even through all the unit conversions.
Over the course of the semester, we took this free-form approach and streamlined it to try to get better and better observations in each subsequent lab. For example, students had a tendency of trying to vary way too many things at once, which made their results difficult to interpret. So we introduced the concept of controls. Students also had a tendency of reporting way too many numbers in their lab reports. So we introduced the concept of significant figures. All of these lab techniques were introduced throughout the semester to show how they improved what we were doing and how we explained it to others. I felt it was a much better approach than a data dump of proper lab techniques on day 1.
There are limits to this approach that will likely require a few more semesters of iteration to figure out. Lab reports tended to be low quality because there were too many data to try to make sense of in too many different formats. Students benefited from being able to see what others did and compare and contrast their results to someone else’s. However, because of the high variability in approaches, it was often difficult for students to find someone who had done something similar enough to run the comparisons they wanted to run. Additionally, graphs were often added to reports just because they looked more science-y regardless of whether the variables plotted made sense to compare to each other. And with lots of class data to work with, students could too easily pick individual student datasets that supported what they wanted to say without considering the whole class picture, which may have differed from their preferred narrative.
Needless to say, by the end of the semester, I started reaching the limits of the approach. For kinematics and dynamics, moving things around in physical space and measuring it can be done pretty easily using the smartphone and kitchen equipment. But collisions were difficult, since we used rolling bottles and most students didn’t have more than one timer that could be used to time two moving objects. Fluids were doable, but measuring mass and volume could be difficult for students if they didn’t have the right kitchen gear. As for heat-pressure-volume, that had the potential to become quite hazardous. Forget electricity and nuclear physics next semester.
Still, I found it to be an interesting approach. We spend way too much of our labs teaching students how to use obscure instruments only to get data that they still don’t know how to interpret. Perhaps labs can become more interesting and useful if we just put a big box of stuff in the center of the lab, give the students a question to explore, and then see what they do. In my experience, most students tended to repeat what they saw me do. But some students became really creative and other students would gravitate towards them, and I think most students walked away with the correct idea that science is fun, creative, and innovative even when looking at something as mundane as rolling bottles.
Notes for Practice
Home Labs
Figure out if you want to teach methodology, instrument usage, data analysis, or critical thinking. Data analysis and critical thinking will probably be much more useful for students, and so methodology and instrument usage can be de-emphasized, at least to start.
Provide students with some basic measuring equipment or work-arounds if they can’t get the right equipment. A smartphone is a pretty versatile measurement instrument for time, distance, and angles, as well as accelerations and atmospheric pressure. Kitchens are equipped with plenty of measuring instruments as well, although they can be of varying quality. Low quality instrumentation, however, can become great teaching moments for uncertainty and significant figures.
Consider just-in-time methodology. Day 1 methodology can be alienating and make experimentation feel constrained and boring. Start with a free-for-all, then gradually introduce methodology improvements (like controls, significant figures, and error reporting) once students see how messy things can be without them.
Emphasize pattern recognition. Students don’t realize that most of what scientists do is pattern matching. Does this look like something we’ve seen before? Does something stick out as odd? If so, why is it odd? Are we observing something new or a mistake? This is a useful skill that students can transfer to other aspects of their lives.
Use a group spreadsheet. Students get visibility into what others are doing and can coordinate their work (if they want to replicate or do a variation for comparison). Some students can be griefers and overwrite or delete others’ work, so ensure you are prepared for this.
